Videos and audio presentations
Note: images link to presentations

What is multilevel modelling? (mp4 video presentation)
Presented by Fiona Steele
"Social science research is about trying to understand individual behaviour which can depend on a number of factors interacting in a complex way …"

Multilevel Structures and Classifications (voice-over with video and slides)
Presented by Jon Rasbash
This presentation is the introduction to Module 4: Multilevel structures and classifications (sample PDF, 0.1 mb)
More about this subject - Multilevel Structures and Classifications

Random intercept models (voice-over with video and slides)
Presented by Rebecca Pillinger
View transcript.
Random intercept models allow us to examine the relationship between two variables after controlling for the clustering in our data; or to discover to what extent differences between individuals in their values of some variable are due to their membership of groups (such as schools or countries) after controlling for their value on some other variable. This presentation (based on a slightly older version of the slides from our Introductory Workshop session on Random Intercept models) covers what random intercept models are, what questions they can answer, what they look like graphically and mathematically, how to interpret the results of fitting a random intercept model, hypothesis testing, variance partitioning coefficients, the correlation matrix, residuals and predictions.
Residuals - An Introduction (voice-over with video and slides)
Presented by Rebecca Pillinger
View transcript
Residuals can be important if we want to rank our units after controlling for a set of covariates (for example when drawing up league tables of schools), or if we are interested in the effect of a particular level 2 unit (for example if we want to see what effect a particular school is having on its students' performance).
In this presentation, we show how both level 1 and level 2 residuals are calculated for multilevel models (though in practice this calculation will usually be performed by the software), and explain why residuals in multilevel models are shrunk in towards the overall regression line.
Measuring Dependency (voice-over with video and slides)
Presented by Rebecca Pillinger
View transcript
We use multilevel modelling when we have dependent data, i.e. there is similarity between observations from the same group (for example, heights of children from the same family).
This presentation explains how to measure the dependency using the variance partitioning coefficient (VPC). We explore the interpretation of the VPC through example graphs. We also see that the VPC shows how much of the variance is due to each level of the model, and thus gives some insight into what extent the response is determined at each level.
Covariance and Correlation Matrices (voice-over with video and slides)
Presented by Rebecca Pillinger
View transcript.
We use multilevel modelling when we have dependent data, i.e. there is similarity between observations from the same group (for example, heights of children from the same family). An obvious question is: just how does the multilevel model take this dependency into account? In this presentation, we examine the structure of the model: we see what the correlation is between each pair of level 1 units in our dataset. This allows us to see how the relation between different observations from the same group is specified by the model. We contrast this to a single level model, for which we see there is no correlation between different observations from the same group.
Significance Testing (voice-over with video and slides)
Presented by Kelvyn Jones
- Tests for coefficients of individual variables: eyeballing standard errors
- Wald tests
- Calculating p-values using the tail areas screen in MLwiN.
- Tests for comparing models: the Likelihood Ratio Test and the Deviance Information Criterion

Random slope models (voice-over with video and slides)
Presented by Rebecca Pillinger
View transcript.
Random slope models allow us to explore the possibility that the relationship between two variables may be different in different groups (e.g. schools or countries). This presentation (based on a slightly older version of the slides from our Introductory Workshop session on Random Slope models) covers what random slope models are, what questions they can answer, what they look like graphically and mathematically, how to interpret the results of fitting a random slope model, hypothesis testing, variance partitioning coefficients, and predictions.
Using quantitative data in research (voice-over with video and slides)
Presented by Rebecca Pillinger
Introduction to online course, Module 1
Sample PDF document: Using quantitative data in research - Concepts* (PDF, 64kB)
Introduction to quantitative data analysis (voice-over with video and slides)
Presented by Rebecca Pillinger
Introduction to online course, Module 2
Sample PDF document: Introduction to quantitative data analysis - Concepts* (PDF, 79kB)
What is it and why you should do it (multilevel modelling) (voice-over with video and slides)
Presented by Jon Rasbash
Slides only: jon-rasbash (Office document, 1,378kB)
Global variations in health and mortality (voice-over with video and slides)
Presented by Kelvyn Jones
Slides only: cliotalk (Office document, 1,146kB)
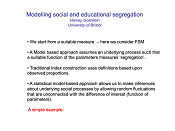
Modelling Social and Educational Segregation (voice-over with video and slides)
Presented by Harvey Goldstein
Slides only: segregation-modelling (Office document, 148kB)
Externally hosted videos
Introduction to Stat-JR (hosted on the NRCM online resources page)
Presented by Bill Browne
Audio presentations
- School league tables: what can they really tell us?
- Listen to part of the programme 'The Learning Curve': ogg (3.0 mb), mp3 (4.2 mb), broadcast by BBC Radio 4 on 16-Jun-2008
- Or listen to the complete BBC programme. School league tables are eagerly scanned by parents hoping to find the best school for their child, and by teachers hoping to see their school rise in the rankings. But do they tell parents what they need to know? Harvey Goldstein and George Leckie argue that league tables are not fit for that purpose, and say it is time that their publication should cease. (Download full article from Wiley Online Library)
- Top of the Class:
- Listen to More or Less: ogg (7.6 mb) mp3 (4.8 mb), Realplayer (4.4 mb) broadcast by BBC Radio 4 on 11-Dec-2006, featuring: Harvey Goldstein. For nearly 15 years, the league table, and its raw material, performance assessment, has been the driving force behind policy; and nowhere more so than in education. In the beginning, it seemed simple: tell parents how good the local school is. But, as Andrew Dilnot discovered, that ambition began an enduring clash of political will with statistical headache. We have steadily learnt over the years, and through repeated reform, how hard to achieve that simple objective is.
If you experience problems accessing any videos, please email info-cmm@bristol.ac.uk.
