Transport Justice in Bristol: Evidence for Equitable Mobility Policy
Transport inequality shapes people’s life chances in their local communities. When buses do not run, or when fares are unaffordable, or when journeys take twice as long as they should, this is more than just an inconvenience, as it can affect access to employment, healthcare, and community life. Our research set out to understand how transport infra structure in Bristol can affect people’s overall life chances, opportunities, and outcomes, with a particular interest in understanding who is affected, how severely, and what can be done about it.
About the research
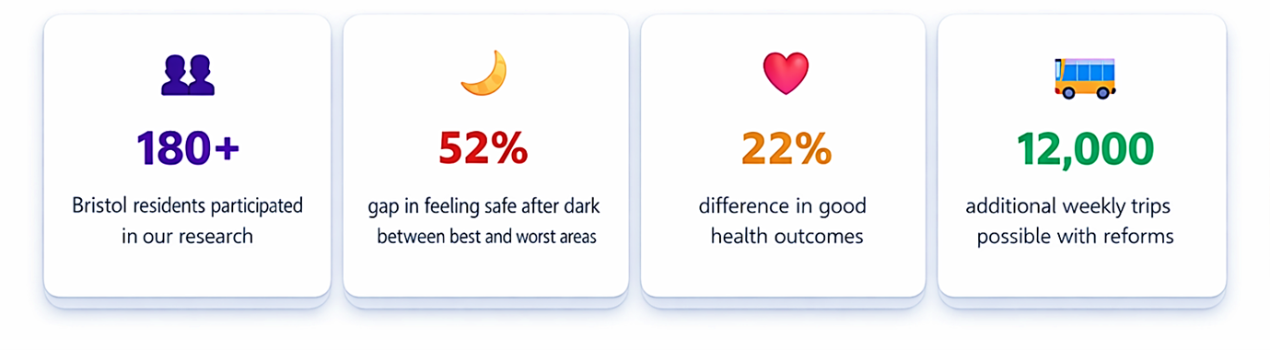
Between January and July 2025, we worked directly with Bristol communities through town halls, focus groups, and surveys involving over 180 residents. We combined their voices with analysis of data across all 34 wards. We then tested our findings with The West of England Mayoral Combined Authority, Bristol City Council, transport operators, and transport users at a dedicated policy symposium. Our research revealed the extent of transport disadvantage in Bristol, as well as the profound connection that it has to health, safety, economic opportunity, and social inclusion.
The recommendations in this briefing are designed to be evidence based, feasible, and directly responsive to the needs of the communities that are impacted by these structural inequities. These recommendations emerged from a participatory process that centred the lived experiences of Bristol residents, particularly those in the most disadvantaged areas, while also connecting these experiences to empirical data and stakeholder expertise.
“The city can’t all be about the Centre. All those bits around the edges get the least service. Until that changes, people have no option but to use cars, and if you don’t have a car then you’re a bit scuppered, really.”
Key findings
Spatial inequality across Bristol wards
Bristol exhibits severe transport inequality. Our Transport Disadvantage Index (TDI), which combines transport poverty metrics, service coverage, and exclusion factors, showed a 64-point gap between the best served ward (Stoke Bishop, 21.7%) and the worst served ward (Hartcliffe and Withywood, 85.9%). Four other wards consistently appear at the bottom across all indicators: Lawrence Weston, Stockwood, Hengrove and Whitchurch Park, and Southmead.
These wards are concentrated in outer estates where residents face a triple burden: high fares relative to income, infrequent services especially in evenings and at weekends, and high proportions of people who do not or cannot drive. The radial network design forces lengthy detours through the city centre for lateral trips. Non-integrated ticketing means residents often pay twice for what could otherwise be a single journey.
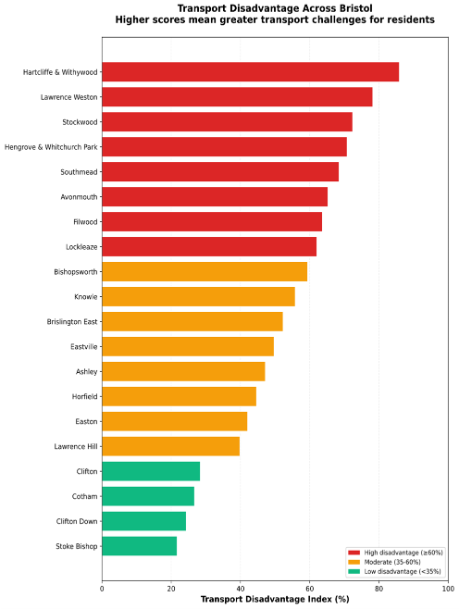
Transport disadvantage: Higher Scores mean greater transport challenges for residents
Transport shapes everything
Even after controlling for general deprivation in our multivariate regression models, transport poverty remained a significant independent predictor of health outcomes: a 1% increase in transport poverty is associated with a 7.6% decrease in good health.
The connections between transport disadvantage and wellbeing are stark. Areas with the worst transport have dramatically lower rates of feeling safe after dark (with a 52-point gap between best and worst areas), good health (a 22-point gap), food security, and mental wellbeing. Fear of crime shows an equally strong link, likely because those reliant on transit feel more vulnerable waiting for buses or walking at night.
Community engagement activities reinforced these patterns. Over 20% of people in the city, and nearly 33% in some wards, report that a lack of transport has prevented them from leaving home when they wanted to. Town hall participants described missing medical appointments, turning down job opportunities, and skipping social activities because of transport barriers.
Who struggles most
A U-shaped pattern appears across the life course, with individuals aged 55 to 64 reporting the highest transport difficulty. Women within this age cohort face the greatest challenges of any demographic group, likely reflecting caring responsibilities, health changes, and the fact that concessionary bus passes do not start until age 65, meaning that this group effectively falls through the policy gap.
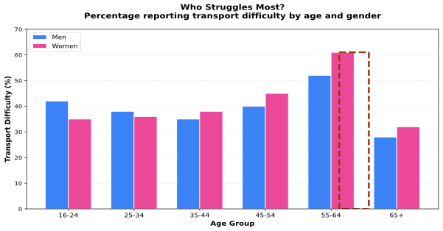
Who struggles most? Percentage reporting transport difficulty by age and gender
What people told us matters most
When asked what would most improve their travel experience, ease of travel topped the list (30% of difficulty), followed by affordability (25%), destination access (20%), actual barriers (15%), and perceived challenges (10%). Residents expressed frustration with ghost buses, non‑integrated ticketing that penalises multi-leg trips, and the absence of evening and weekend services in peripheral wards (though it is worth noting that weekend evening services have seen some improvement over the course of the project).
The active travel paradox
While walking and cycling show the lowest difficulty scores, 57.1% of respondents reported feeling unsafe cycling. The barrier is not equipment (74.1% have cycling equipment) but safety. Ward‑level cycling rates vary 40‑fold, from 48.3% in Easton to 1.2% in Hengrove and Whitchurch Park. Wards with the worst public transport also have the lowest active travel rates, which creates a double burden for residents who lack both reliable transit and safe cycling or walking routes. However, active travel and public transport are not alternatives but complementary systems that must both function effectively.
How we did this research
This research was co-produced with Bristol communities. We conducted town halls and focus groups in five wards, surveyed 133 residents with oversampling in transport desert areas, and carried out one-to-one interviews with key informants. We combined this with ward-level analysis across all 34 Bristol wards using Quality of Life Survey 2023‑24 data and Census 2021 demographic indicators. Our findings and recommendations were tested at a policy symposium with representatives from WECA, Bristol City Council, First Bus, and community organisations.
Policy Recommendations
These recommendations have been presented and refined through dialogue with WECA, Bristol City Council, transport operators, and community members at our policy symposium.
Short term (within 12 months): quick wins that can be delivered now
- Deploy co-designed transport information in community hubs with multilingual options and QR codes linking to real‑time information.
- Introduce pre‑65 fare concessions for 55‑64‑year‑olds, the group facing the highest transport difficulty.
- Extend evening services on key routes serving outer estates and enforce pavement parking bans to clear walking routes.
Medium term (1 to 3 years): pilot projects testing new approaches
- Trial demand-responsive orbital shuttles connecting peripheral neighbourhoods without requiring city centre detours.
- Pilot integrated multi-operator digital ticketing with one-hour transfer windows and targeted mobility credits for jobseekers in high-disadvantage wards.
- Launch subsidised e-bikes and quick-build protected cycle lanes in outer estate corridors.
Long term (3 to 10 years): structural reforms
- Move towards bus franchising or a strengthened enhanced partnership under the Bus Services Act, giving WECA greater control over routes, fares, and service standards.
- Reconfigure the network with dedicated orbital routes and cross‑city through‑routes; establish a Permanent Transport Inclusion Forum with community representatives.
- Set equity targets tracked through annual Bristol surveys, focusing on closing gaps rather than improving averages.
Our modelling suggests that comprehensive reform, combining reductions in transport poverty and exclusion, could reduce the Transport Disadvantage Index gap by 50% within five years and enable 12,000 additional weekly trips from currently excluded residents.
Further information
Full report: Transport Justice in Bristol: Rethinking Access, Equity, and Policy Impact
Interactive data dashboard: Bristol Transport Project,
Project blog and research team: btrp. blogs.bristol.ac.uk
This research was supported by the University of Bristol’s ERC Fund, funded by UKRI Research England.
The researcher
Dr Ruth Badru, Associate Professor, University of Bristol