Life History from X-Ray imaged teeth
Background
Fossil and bone records can tell us valuable information on the life history of ancient animals, including how long they lived, how fast they grew and whether they hibernated in winter.
Some methods of harvesting this data are more destructive than others- one typical method is to make thin slices of the fossil and then image them under a microscope, which gives us lots of information about the fossil’s internal structure but is completely destructive. Modern analyses increasingly use imaging technology such as CT scanners to make 3D models of the internal structure of these fossils, which leaves the fossil physically intact (although it does destroy any DNA inside it).
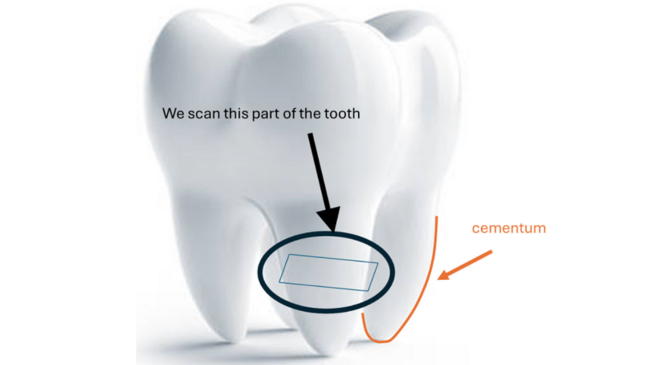
As a proof of concept, in this project we used CT scans of healthy human teeth that were removed during orthodontic procedures. These are much better preserved than typical fossils, which allowed us to quickly test if the method worked and to perform a proof-of-concept analysis. On the root of the tooth there is a substance called cementum which grows in layers, like the rings of a tree. One layer of cementum grows per year; the thickness, curvature and of shape which tells us about the overall amount of bone that grew that year. We expect that the shape of these layers will be different during significant life events that affect bone turnover such as puberty, pregnancy, menopause and serious injury.
Project Aim
A researcher who wants to look at the shape of these cementum layers would typically have to label them “by hand”- this takes a long time, and involves manually labelling where each layer in the CT image is. In principle, this process can be automated by using computer vision algorithms- this project is a first step towards such an algorithm.
With the use of an AI model, specifically a convolutional U-net model, we were able to locate the cementum region in the image. We then straightened this region, and from there were able to use a “ridge filter” pick out the layers in the straightened image.
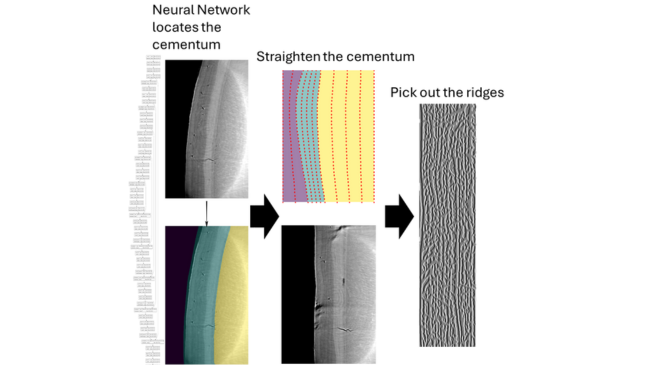
Further analysis on the number and shape of ridges can tell us about the age, sex and life history of the organism.
How the JGI Data Scientist helped on this project
Richard Lane worked with Prof. Kate Robson Brown and Dr. Elis Newham to design and implement the computational algorithms for the proof-of-concept analysis pipeline.
Project next steps
This method for picking out ridges is much faster than doing so manually, which would enable several new areas to be researched. Using the dataset of orthodontically extracted healthy teeth, we could extend our proof-of-concept analysis to identify which features in the cementum layers are associated with life events such as pregnancy and puberty, and how gender affects the cementum’s structure.
The true structure of the cementum ridges is 3D, so a further extension to this project would be to perform the analysis in three dimensions- instead of labelling the ridges from 2D images, we would create 3D models of the cementum layers.
Following on from these steps, a wide variety of datasets could be analysed. This method could be used to analyse fossil records to investigate how prehistoric mammals grew, used for pathology in helping to identify teeth fragments or even used to analyse how astronauts’ bone growth is affected by microgravity.
Acknowledgements
Elis Newham, Queen Mary University London, supported by Richard Lane, Data Science Specialist at the JGI