
Fuel Poverty
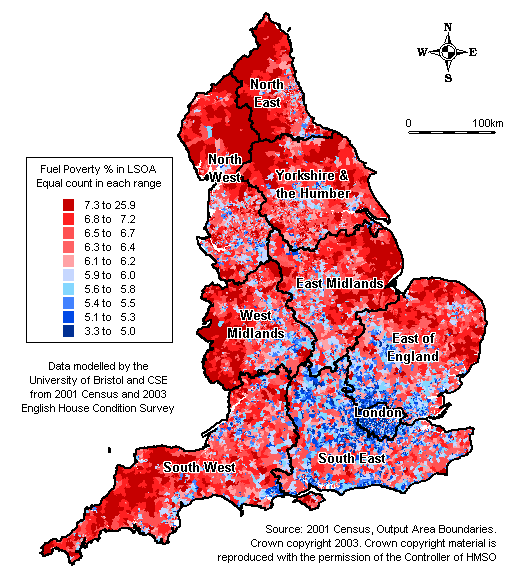
The Government’s objective of eliminating fuel poverty in England by 2016 partly depends on our ability to identify and target concentrations of fuel poverty at a local level. Our research draws on data from three sources: the 2001 Census, the 2003 English House Condition Survey (EHCS); and the national property database, RESIDATA to develop small area Fuel Poverty measures which can be used to inform affordable warmth policies and local fuel poverty reduction strategies. It uses this data to draw up a series of maps and showing the incidence of fuel poverty at ‘Lower Super Output Area’ level – geographical units of varying size but which typically contain about 400 households.
Dr Eldin Fahmy, Professor David Gordon and Dr Demi Patsios of the Townsend Centre for International Poverty Research have been working closely with the Bristol charity, Centre for Sustainable Energy (CSE) and other research funders including the Department for Business, Enterprise and Regulatory Reform, the Welsh Assembly Government and the South West Electricity Board in developing small area estimates of fuel poverty to better target affordable warmth policies and initiatives. developed an on-line tool – known as the Fuel Poverty Indicator (FPI) - to predict the incidence of fuel poverty in each electoral ward in England.
The four definitions of fuel poverty used for the fuel poverty indicator are:
1. 'Full income': a household is in fuel poverty if, in order to maintain a satisfactory heating regime and cover other normal fuel costs, it would be required to spend more than 10% of its income on all household fuel use - 'Income' by this definition includes Housing Benefit, Income Support for Mortgage Interest, and Council Tax Benefit..
2. 'Basic income': as above except that Housing Benefit, Income Support for Mortgage Interest and Council Tax Benefit are not included as income.
3. 'Full income (equivalised)': as (1) except that income is 'equivalised'(*) and very low incomes are not 'imputed'(**).
4. 'Basic income (equivalised)': as (2) except that income is 'equivalised'(*) and very low incomes are not 'imputed'(**).
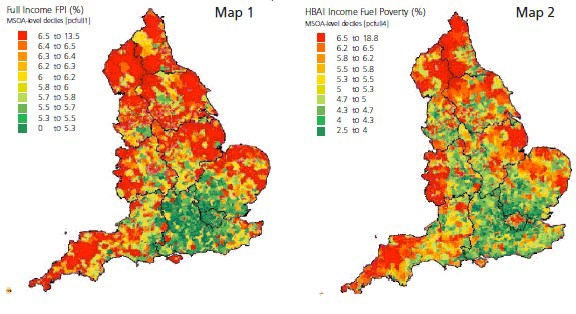
Definitions (1) and (2) are used for the Government's official fuel poverty statistics. Definitions (3) and (4) are consistent with the measurement of income used by the Government's Households Below Average Income (HBAI) statistical series.
(*) 'Equivalised' incomes refer to a process by which incomes are adjusted for household size and composition. (**) 'Imputed low incomes' refers to a process used in the EHCS by which all households are assumed to have incomes at benefit levels, as a minimum. By contrast, the HBAI assumes reported low incomes are accurate. More information about the four definitions is given in the full report of the research.
→ The full report of the methodology used for producing the FPI is available here. [DOC, 1.7MB]
The statistical model of the FPI is an updated and improved version of the 1996 original. You can find a report of the research of the 1996 version here and the 1996 data on the Data download page
Launched at the Department of Trade and Industry in May 2007, it was designed to help a range of professionals whose efforts are central to the eradicating fuel poverty: policy-makers, local authority officers, specific staff within the energy utilities, energy efficiency advisers, health professionals and others in the energy and health sectors.
For these groups, the benefit of the Fuel Poverty Indicator is that it helps focus their efforts and resources on small areas where the need is greatest, thus avoiding a costly and inefficient ‘scatter-gun’ approach. Using an approach to income measurement which is consistent with international best practice produces a picture of the distribution of fuel poverty across England as illustrated in Map 2 (below). Although this approach (as compared to the UK government's approach) results in only a small net change in overall fuel poverty rates, the spatial distribution changes substantially at regional and local levels. This shows that fuel poverty is also widespread in urban areas including London and the metropolitan areas.


Finding the Maps for Your Area
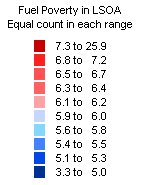
The FPI is mapped by Lower Super Output Area (LSOA) at decile ranges for every county in England. Each decile has the same number of LSOAs according to the proportion of households in fuel poverty across England. All maps are mapped to the same criteria. The decile ranges are:

You can access the Fuel Poverty Indicator maps by selecting a region on the map below:

Please note that the FPI maps correspond to definition 1 (above), the Government's official definition of fuel poverty.

Using the FPI
There are many possible uses for the FPI some of which are outlined below. We would welcome feedback on how you have used the FPI and are considering putting case studies of FPI use on this website in the future.
Affordable Warmth Strategies
The FPI can make a valuable contribution towards local affordable warmth strategies, for example:
- Providing baseline data for the strategy Providing a tool for monitoring the strategy by combining the FPI with other local data (e.g. SAP, benefit take-up, decent homes) which is regularly updated
- Raising awareness of fuel poverty as an issue of concern (the maps are particularly useful in this respect)
- Engaging local political representatives in strategies, particularly those representing areas with high levels of fuel poverty
- Making a case for funding initiatives in high fuel poverty areas
- Assessing the level of need in an area and securing appropriate resources to meet that need
Informing Affordable Warmth Policies
You can use the FPI to help inform policies by considering the distribution of fuel poverty in your area, for example:
- Targeting policies and programmes on high fuel poverty areas
- Consider area targeting of programmes where there are wide variations in FPI scores
- Consider non-area specific programmes where there are low variations in FPI scores
- Establish the relationship between high fuel poverty areas and other area-based policy initiatives, e.g. health, regeneration
- As a basis for 'rolling out' area-based programmes according to the extent of fuel poverty
Reaching the Fuel Poor
You can use the FPI to help make sure programmes are reaching the fuel poor, for example:
- Marketing initiatives, information provision and focused advice, such as home visits and take-up campaigns
- Making sure grant programmes and other fuel poverty resources are reaching areas with high levels of fuel poverty
- Ensuring fuel poverty policies are tailored to the particular characteristics of the areas you are targeting, e.g. rural, inner city, large minority ethnic populations
Research
You can use the FPI to help inform research, for example:
- The relationship between fuel poverty and other deprivation indicators
- The relationship between fuel poverty and health inequalities
- Analysing the extent to which the allocation of fuel poverty resources and services match need
- Comparing the impact of the different fuel poverty definitions on the 'geography of fuel poverty'
The Townsend Centre can also provide a bespoke service for interested parties, e.g.
- Maps and data of the FPI at Output Area level for particular areas
- Maps and data on fuel poverty using alternative definitions of fuel poverty (e.g. using an ‘after housing costs’ definition of income)
- Interpretation of the distribution of fuel poverty within a particular area and its implications for the planning and delivery of fuel poverty programmes/strategies.
For further info please contact: Dr Eldin Fahmy.
→ Updating the Fuel Poverty Indicator for England
Dave Gordon and Eldin Fahmy
[PPT, 787KB]
→ Predicting fuel poverty at the local level: Final report on the development of the Fuel Poverty Indicator, Dave Gordon, William Baker and Graham Starling
[PDF, 0.9MB] [DOC, 1.3MB]
Visit the Regional Poverty Studies page to view maps of fuel poverty in local areas.


